
Effect of Vitamin C on Tooth Growth in Guinea Pigs
Basic Inferential Data Analysis on ToothGrowth dataset (part of Statistical Inference by Johns Hopkins University)
This assignment was part of the Johns Hopkins Coursera module on Statistical Inference as part of the Data Science Specialization.
Source code available on GitHub
Overview
The goal is to conduct some simple hypothesis testing on the ToothGrowth dataset available in the R datasets package.
Some assumptions:
- equal variances among groups
- standard deviation estimated from the samples
is set to 5%
- samples are not paired
Data processing
We import the data and directly set the dose as a factor.
library(ggplot2)
library(datasets)
tg <- datasets::ToothGrowth
tg$dose <- as.factor(tg$dose)
Glimpse at data.
str(tg)
## 'data.frame':    60 obs. of  3 variables:
##  $ len : num  4.2 11.5 7.3 5.8 6.4 10 11.2 11.2 5.2 7 ...
##  $ supp: Factor w/ 2 levels "OJ","VC": 2 2 2 2 2 2 2 2 2 2 ...
##  $ dose: Factor w/ 3 levels "0.5","1","2": 1 1 1 1 1 1 1 1 1 1 ...
summary(tg)
##       len        supp     dose
##  Min.   : 4.20   OJ:30   0.5:20
##  1st Qu.:13.07   VC:30   1  :20
##  Median :19.25           2  :20
##  Mean   :18.81
##  3rd Qu.:25.27
##  Max.   :33.90
Some plots.
qplot(x=len, data=tg, color=dose, group = dose, geom = "density", facets = dose ~ supp)
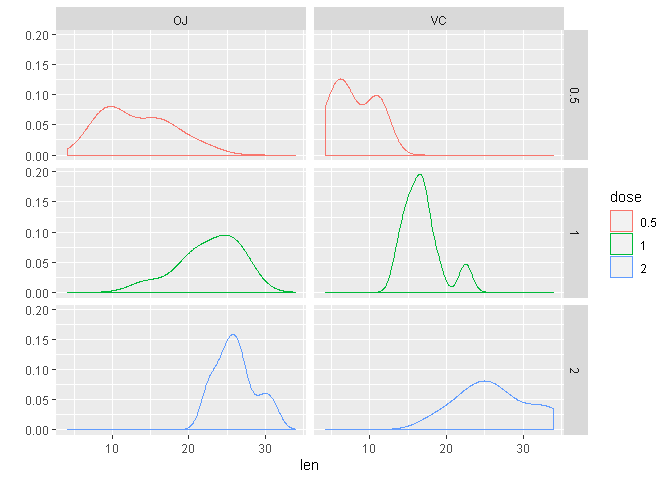
Has the delivery method an impact on tooth growth?
We will test in regards of the null-hypothesis that their is no difference in means between the two groups.
n = 10
x = tg[tg$supp=="OJ", "len"]
y = tg[tg$supp=="VC", "len"]
delta = mean(x) - mean(y)
p.sd = sqrt((var(x)+var(y))/2)

t.res <- t.test(x, y, alternative = "two.sided", mu = 0, paired = FALSE, var.equal = TRUE)
p.res <- power.t.test(n, delta, p.sd, sig.level=0.05, type="two.sample", alternative="two.sided")
We have a p-value (6.0393371%) larger the 5% and in addition the confidence interval (-0.1670064, 7.5670064) covers the value 0. We fail to reject the null hypothesis in this case.
Has the dose an impact on tooth growth?
We test the difference in means between each dosage (3 tests: 0.05 vs 1, 0.5 vs 2, 1 vs 2).
n = 10
x = tg[tg$dose=="0.5", "len"]
y = tg[tg$dose=="1", "len"]
delta = mean(x) - mean(y)
p.sd = sqrt((var(x)+var(y))/2)

t.res.a <- t.test(x, y, alternative = "two.sided", mu = 0, paired = FALSE, var.equal = TRUE)
p.res.a <- power.t.test(n, delta, p.sd, sig.level=0.05, type="two.sample", alternative="two.sided")
n = 10
x = tg[tg$dose=="0.5", "len"]
y = tg[tg$dose=="2", "len"]
delta = mean(x) - mean(y)
p.sd = sqrt((var(x)+var(y))/2)

t.res.b <- t.test(x, y, alternative = "two.sided", mu = 0, paired = FALSE, var.equal = TRUE)
p.res.b <- power.t.test(n, delta, p.sd, sig.level=0.05, type="two.sample", alternative="two.sided")
n = 10
x = tg[tg$dose=="1", "len"]
y = tg[tg$dose=="2", "len"]
delta = mean(x) - mean(y)
p.sd = sqrt((var(x)+var(y))/2)

t.res.c <- t.test(x, y, alternative = "two.sided", mu = 0, paired = FALSE, var.equal = TRUE)
p.res.c <- power.t.test(n, delta, p.sd, sig.level=0.05, type="two.sample", alternative="two.sided")
##                      dose.0.5v1      dose0.5v2      dose.1v2
## p-value            1.266297e-07  2.837553e-14  1.810829e-05
## conf-interval-low -1.198375e+01 -1.815352e+01 -8.994387e+00
## conf-interval-up  -6.276252e+00 -1.283648e+01 -3.735613e+00
## power              9.909607e-01  1.000000e+00  9.057799e-01
Conclusions
We failed to reject the null-hypothesis regarding the impact of the delivery method on tooth growth.
The dosage was found to be statistically significant and tests rejected the null-hypothesis.